

Jamie Boex and Sonja Walti
While the number of women elected to the U.S. Congress and state assemblies is on the rise, there continues to be a clear gender gap in political representation at the federal and state levels. For instance, in 2018, women accounted for merely 20.6 percent of the members of Congress, a share that increased to 23.7 by 2019.
What about the local level? Are women better represented locally? After all, the local level is where important decisions are made, including decisions directly affecting families and the local community, long assumed to be women’s primary driving force to seek public office. As the level of government closest to the people, one might expect local governments to be more representative than federal and state governments.
Although the election of a female mayor or county executive is still rare enough to make headlines, little is known about the current participation and representation of women at the local level. The sheer number of local governments—including 3,031 counties; 35,879 municipalities, towns and townships; 12,880 school districts and 38,266 special districts—makes it nearly impossible to regularly track the composition of local elected offices. What’s more, different states have different local government structures, and different local governments—even within the same state—may have different electoral systems. Thus, tracking “women’s representation in the United States requires attention to a variety of elected and appointed offices across a diverse set of sizes, locations, positions, and types of government.” (Holman, 2017).
While data are unavailable to consider the participation and representation of women across all types of local governments, we were able to exploit a publicly available county dataset to better understand women’s voice in local decision-making.[1]
To what extent do women share in local decision-making at the county level?
As part of its efforts to represent the nation’s county governments, the National Association of Counties (NACo) offers an up-to-date list of the names and positions of elected officials in every county, including each county’s governing board.[2] Based on that list, we analyzed the number (and share) of women who held elected county governing board positions in 2018 to better understand the participation and representation of women at the local level. [3] In addition, we analyzed the share of women that held elected non-board county positions in 2018 (such as Clerks of County Court, County Attorneys, Sheriffs, and so on).
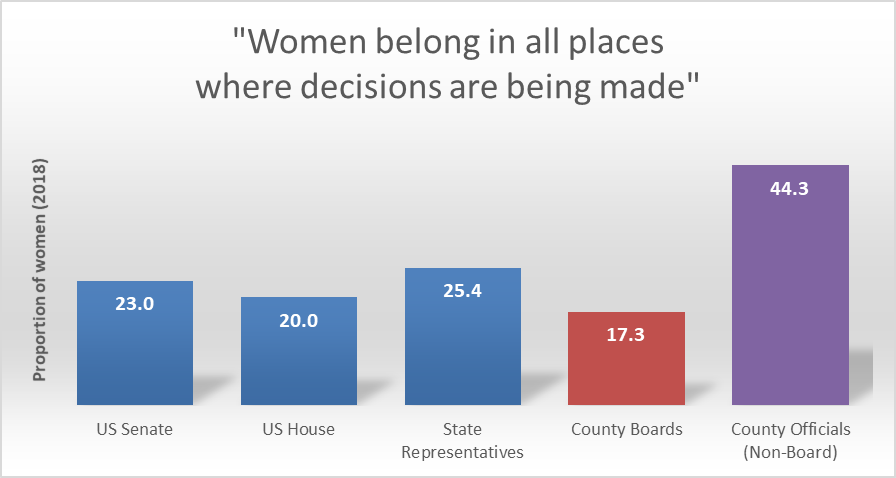
Our analysis suggests that, on average, only 17.3 percent—or only about one in six county commissioners—are women.[4] Five out of six are men. This is noticeably lower than women’s political voice at the state and federal levels.
The gender gap among political decision-makers at the county level is very troubling considering that women do in fact seek to take part in local affairs, as exemplified by their representation in elected non-board positions, where women participate almost on par with men. Women on average hold 44.3 percent of these non-board county positions.
So, what’s going on?
Why do women hold such a small share of decision-making power on county boards? The fact that they are highly represented in other (non-board) county positions rules out that women simply aren’t interested in holding office at the county level. And the fact that they are better represented at the state and federal levels eliminates other obvious culprits, such as voter attitudes against women in elected positions, or the availability of qualified woman candidates.
The gender gap at the county level does not appear to be a new phenomenon. When compared with the 1992 Census of Governments, which was the last time comprehensive data on locally elected officials was collected by the Census Bureau, our findings to some extent mirror those revealed in 1992, especially when it comes to the female under-representation at the county level vis-à-vis the state level (Table 1). Although the representation of women has since increased across all government levels, in both years, county boards consistently count a smaller proportion of women than state legislatures. Likewise, then as now, considerably more women are elected to non-board county positions than to county board positions.
| Table 1. Proportion of women among elected representatives (%), 1992 and 2018 | ||
| 1992 | 2018 | |
| U.S. Congress | 6.0 | 20.6 |
| State legislatures | 18.4 | 25.4 |
| County board members | 11.2 | 17.4 |
| County (non-board) officials | 18.0 | 44.6 |
| Municipalities, towns and townships | 14.8 | — |
| School district boards | 26.2 | — |
| Special district boards | 10.2 | — |
| Sources: Rutgers University Center for American Women and Politics; Census of Governments 1992; authors’ calculations based on NACo data. | ||
What could account for this discrepancy at the county level? While religious forces and, to a lesser degree, political forces may be impediments to female representation (Kellogg et al. 2017), those forces are presumably no different from other levels of government and thus unlikely to account for the gender gap found specifically at the county level.
In pursuing the answer to this question further, three main avenues of reasoning specifically related to county affairs are worth exploring. First, political decision-making positions may be viewed fundamentally different (by voters and/or candidates) when compared to non-political (administrative or executive) positions. Second, there may be something different about the nature or governance structure of county boards that systematically results in fewer women being elected when compared to state and federal offices. And, third, county governments may be perceived as being responsible for “male-oriented” or “male-dominated” policy domains or functions, which may dampen women’s interest in running, or voters’ inclination in voting for them, as county commissioners.
Are elected decision-makers different from elected administrators?
While a definitive explanation for the current under-representation of women on county boards is beyond the reach of this exploratory note, we did observe some interesting patterns when we compared female representation on county boards, non-board positions, and state legislatures across states:
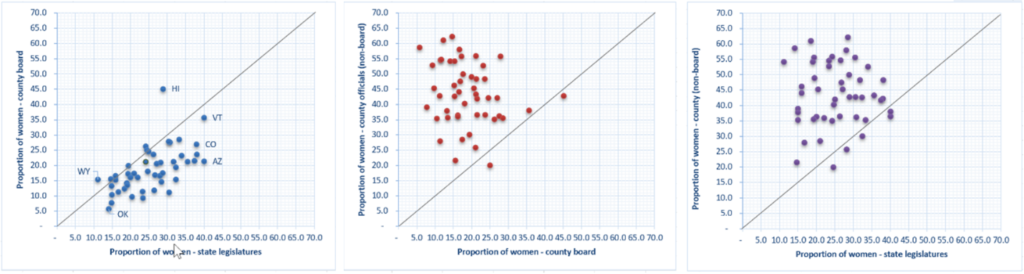
In states that see more women elected to the state legislature, comparatively more women can also be found on county boards, though—as discussed—at a lower rate. The positive and relatively strong correlation (r=0.59) between the proportion of elected women county commissioners in each state and the proportion of women state legislators suggests that there are underlying electoral dynamics that propel more women into office in some states when compared to others.
At the same time, it does not appear to be the case that in states where more women are elected to non-board county positions, more women were elected to county boards (or vice versa). Nor does there appear to be any correlation between the share of women elected to non-board positions at the county level and the proportion of women elected to the state legislature. This suggests that there is a fundamentally different dynamic at play when women seek and hold elected non-board positions at the county level versus women seeking, and being elected to, positions of political power at the state and local level.
Are county governance and electoral structures stacked against women?
A second issue worth exploring is whether there might be something different about the governance structure of county boards that systematically results in fewer women getting elected when compared to state and federal offices. In other words, are county board structures gender-biased?
There are ways in which county electoral structure could potentially discourage or disadvantage women. For instance, the small size of decision-making bodies at the county level, which on average count only 5.7 members, may prevent or dissuade women from seeking office, by the sheer fact that they may be the first and only woman commissioner. Furthermore, in contrast to the deliberative nature of state and federal legislatures, county decision-making may be prone to bargaining and bartering, possibly leaving women on the sidelines.
Kellogg et al. (2017) suggest that some critical structural factors may indeed limit women’s participation and representation at the county level. Most notably, a county’s election format seems to affect female representation, with counties relying on single-member districts increasing the odds for women versus multi-member at-large elections. Likewise, a larger county board appears to act in favor of women county commissioners. The fact that county election structures in many states may be biased against women warrants further investigation and policy debate.
Are county board functions male-oriented?
Having established that there is a gender representation gap between county boards and state legislatures, and even more so, between county boards and non-board county positions, the question arises whether county boards have distinct “male-oriented” functions. An argument could be made that the role of county boards is perceived—either by candidates and/or by voters—as being relatively more male-oriented than the role of other elected positions: county boards might deal more with “male-dominated” sectors or issues—such as land development and road infrastructure—and not so much with education, health care provision, or social services traditionally associated with female decision-making. Because of this functional misconception, fewer women may feel qualified and/or inclined to run as county commissioner. Alternatively, voters may perceive male candidates as more qualified.[5] It will be important to explore this perception further, both among potential candidates and among the voting public.
While county governments have broad mandates over land development and public infrastructure in many states, county governments are often also responsible for the provision of a wide range of community and social services. As such, the perception of counties as being focused on male-dominated sectors or issues may be a Catch 22: as long as county boards are heavily dominated by men with backgrounds in land development and the like, counties may disproportionately focus their spending on county infrastructure as opposed to directing greater spending towards social and community programs, thus perpetuating the existing bias in representation.
We should measure what we treasure
The nature of political representation—ensuring that our
democratic systems represent all Americans—is receiving increasing attention.
However, this attention has largely been limited to the federal and state
level, overlooking important trends in women’s representation at the local
level. In order to “measure what we treasure”, systematic efforts should be
made to regularly analyze the state of political representation at the local
level—including the participation and representation of women—across all arenas
of local government.
[1] County governments are often overlooked and considered a “forgotten government level”. This is surprising considering that counties are among the oldest forms of local government and the most consistent general-purpose local government in the U.S. (as only a handful of states do not rely on county governments). County governments are responsible for over US$ 550 billion in public spending each year and count over 3.5 million employees.
[2] County governing boards (and their members) are structured differently and referred to by different names in different states, including County Board of Supervisors; County Commission; Commissioners Court; County Council, and so on. Although practices vary considerably among and within states, a typical structure is for a county government to be led by an elected Board or Commission with five members.
[3] We accessed these data through NACo’s online County Explorer tool in August 2018. In order to predict the gender of each of the 38,375 elected officials at the county level, we relied on an automated analysis of the first names of these officials using an online gender prediction tool (www.genderize.io). In select cases, the gender prediction was manually assigned. The current analysis is based on preliminary data for 37,323 elected county officials (98.0 percent) for which gender was tentatively determined: a detailed state-by-state review of the assigned gender will be conducted in the future.
[4] A recent study by Kellogg et al. (2017) found that, based on a random sample of counties, 50.7 percent of the sampled counties had no women at all serving as county commissioner. In 32.9 percent of counties, less than a third of supervisors were women. Only in 16.4% of them, a third or more were women.
[5] The argument of a sector being “male dominated” could equally be made for elected law enforcement positions. In fact, in the case of elected Sheriffs, 95% of positions are held by men, versus 5% by women.